んで、前エントリーの続き。
NTPsec に変えた一番の目的は、 ntpviz という ntp に関する統計情報を出力するコマンドがある、ってことなので、それを含む ntpsec-ntpviz パッケージをインストールして、統計情報が取れることを確認します。
まずは、 aptitude コマンドに -s オプションつけて、依存関係を確認。
root@vhost01:~# aptitude -s install ntpsec-ntpviz

以下の新規パッケージがインストールされます:

  aglfn{a} gnuplot{a} gnuplot-data{a} gnuplot-qt{a} libwxbase3.0-0v5{a} libwxgtk3.0-0v5{a}

  ntpsec-ntpviz

更新: 0 個、新規インストール: 7 個、削除: 0 個、保留: 24 個。

アーカイブの 6,863 kB を取得する必要があります。展開後に 24.3 MB のディスク領域が新たに消費されます。


注意: 'シミュレーション' モードを使用します。

先に進みますか? [Y/n/?] y

パッケージのダウンロード/インストール/削除を行います。
削除されるものはないようなので、このままインストールするなら、-s を外して、aptitude を実行すれば、完了。
ntpviz コマンドを実行してみる
細かい使い方とかオプションは、 "man ntpviz" するか、NTPsec サイトに有るドキュメントを参照してもらうとして、実際に特定に NTP サーバとの Offset に関する統計情報を出力するには、以下のようにコマンドを実行します。
root@vhost01:~# ntpviz --peer-offsets ntp-a2.nict.go.jp

set grid

set autoscale xfixmin

set autoscale xfixmax

set xdata time

set xlabel "Time UTC"

set xtics format "%d %b\n%H:%MZ"

set timefmt "%s"

set lmargin 10

set rmargin 10

set terminal png size 1340,720

set title "vhost01.local.downtown.jp: Peer Offset ntp-a2.nict.go.jp"

set ylabel ""

set ytics format "%.1f ms" nomirror

set yrange [-0.8955:3.5569]

set key top right

plot  0.3909 title '50th percentile', '-' using 1:($2*1000.0)  title 'ntp-a2.nict.go.jp' with line, \

'-' using 1:(($2+$3/2)*1000.0) title 'offset+rtt/2' with line, \

'-' using 1:(($2-$3/2)*1000.0) title 'offset-rtt/2' with line


1520082169.9069996 0.000877718 0.006074248

1520082171.9029999 0.000886769 0.005951494

1520082173.9040003 0.001002837 0.006294607

1520082175.9029999 0.000845034 0.006395244

1520082177.9029999 0.000154835 0.006268685

1520082179.9029999 0.000068847 0.006168117

1520082238.9029999 0.000573531 0.006166704

1520082305.9029999 0.001171861 0.006490722

1520082371.9029999 0.001739808 0.006436721

1520082437.9029999 0.002143953 0.006363756

1520082506.9029999 0.002659486 0.006837424

1520082574.9029999 0.000615921 0.006515450

1520082641.9029999 -0.000142259 0.006613719

1520082710.9029999 -0.000232807 0.006154115

1520082778.9029999 -0.000240509 0.006034757

1520083317.9020004 0.000009325 0.005811048

1520083857.9029999 0.000189473 0.006146113

1520083994.9029999 0.000548237 0.006358728

1520084467.9029999 0.000307157 0.006439212

1520084737.9020004 0.000390939 0.005914518

1520085779.9029999 0.000421743 0.006194988

1520085908.9029999 0.000345647 0.006118246

1520086307.9029999 0.000400457 0.005986258

1520086571.9020004 0.000375874 0.005964945

1520086835.9020004 0.000262098 0.005901524

1520088949.9029999 0.000424563 0.005911586

1520089471.9029999 0.000545216 0.006119386

1520090532.9029999 0.000681996 0.006185292

1520091598.9029999 0.000646152 0.006545365

1520092139.9029999 0.000566383 0.006364219


-- snip --
実際にはパッケージのインストール時に、統計情報の取得と結果を元にグラフ化する為の cron 用の設定ファイル( /ect/cron.d/ntpsec-ntpviz )や、グラフ化したデータを表示するための Apache 用の設定ファイル( /etc/apache2/conf-available/ntpsec-ntpviz.conf )が展開されているので、自前で設定書いて、という部分はとりあえずやらなくても良い形にはなっています。
root@vhost01:~# more /etc/cron.d/ntpsec-ntpviz

53 *     * * * root if [ ! -d /run/systemd/system ] ; then ntpviz -p 1 -o /var/lib/ntp/ntpviz/day  @/etc/ntpviz/options 2> /dev/null ; find /var/lib/ntp/ntpviz/day  -type f -mtime +1 -delete ; fi

45 11,23 * * * root if [ ! -d /run/systemd/system ] ; then ntpviz -p 7 -o /var/lib/ntp/ntpviz/week @/etc/ntpviz/options 2> /dev/null ; find /var/lib/ntp/ntpviz/week -type f -mtime +7 -delete ; fi

*/5 *    * * * root [ ! -d /run/systemd/system ] && [ -e /run/gpsd.sock ] && [ -x /usr/sbin/ntploggps ] && /usr/sbin/ntploggps -o -l /var/log/ntpstats/gpsd 2> /dev/null

*/5 *    * * * root [ ! -d /run/systemd/system ] && [ -x /usr/sbin/ntplogtemp ] && /usr/sbin/ntplogtemp -o -l /var/log/ntpstats/temps
root@vhost01:~# more /etc/apache2/conf-available/ntpsec-ntpviz.conf

Alias /ntpviz /usr/share/ntpsec-ntpviz/ntpviz

<Directory /usr/share/ntpsec-ntpviz/ntpviz>

    Options +FollowSymLinks

    AllowOverride None

    DirectoryIndex index.html

</Directory>
cron の設定見ると、3 行目と 4 行目で 5 分おきに統計情報の取得を実行、1 行目に毎時 53 分に日次データの処理、2 行目に 11:45 と 23:45 に週次データの処理を行なうように設定されています。この 1 行目と 2 行目で処理された集計結果を Web ブラウザで確認できるというわけ。( Apacheがインストールされている場合は、という前提があるのだけど…。 )
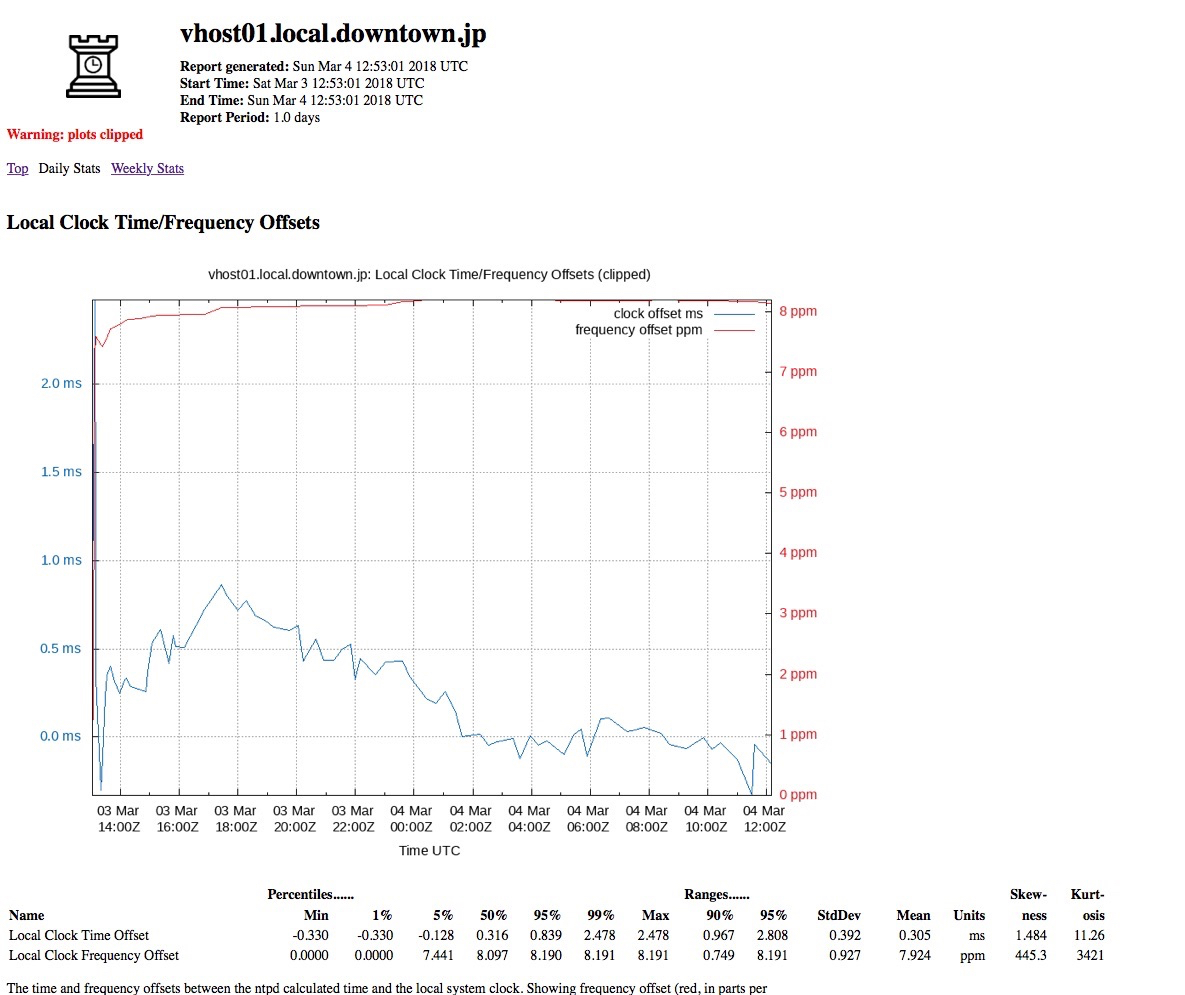
実際に表示させると、下のようなグラフを見ることが出来ます。
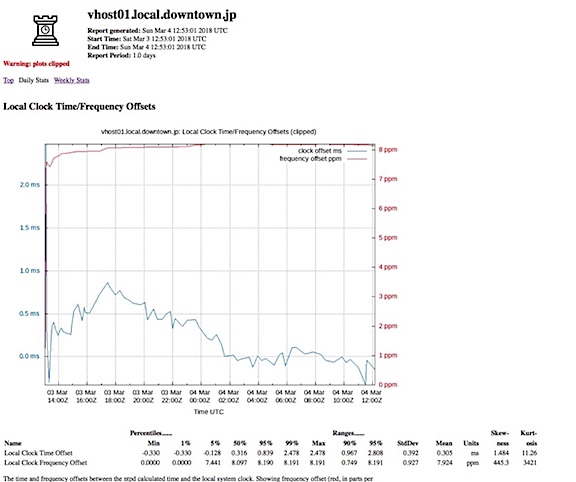
この Web で見れるグラフの元データは、 /var/lib/ntp/ntpviz/day/ に格納されているので、ここにあるファイルをパースして Zabbix に放り込む、と言った使い方も出来るんじゃなかろうかと思うのですが、それについては要研究、ということで…。
root@vhost01:~# ls -l /var/lib/ntp/ntpviz/day/

合計 392

-rw-r--r-- 1 root root  1150  3月  3 22:53 favicon.ico

lrwxrwxrwx 1 root root    27  2月 21 15:29 footer -> /etc/ntpviz/day/footer.html

lrwxrwxrwx 1 root root    27  2月 21 15:29 header -> /etc/ntpviz/day/header.html

-rw-r--r-- 1 root root 51009  3月  4 21:53 index.html

-rw-r--r-- 1 root root 19523  3月  4 21:53 local-freq-temps.png

-rw-r--r-- 1 root root 12835  3月  4 21:53 local-jitter.png

-rw-r--r-- 1 root root  9721  3月  4 21:53 local-offset-histogram.png

-rw-r--r-- 1 root root 14846  3月  4 21:53 local-offset.png

-rw-r--r-- 1 root root 13733  3月  4 21:53 local-stability.png

-rw-r--r-- 1 root root 16723  3月  4 21:53 local-temps.png

-rw-r--r-- 1 root root  1583  3月  3 22:53 ntpsec-logo.png

-rw-r--r-- 1 root root 12988  3月  4 21:53 peer-jitter-133.243.238.163.png

-rw-r--r-- 1 root root 12025  3月  4 21:53 peer-jitter-133.243.238.164.png

-rw-r--r-- 1 root root 13298  3月  4 21:53 peer-jitter-133.243.238.243.png

-rw-r--r-- 1 root root 11927  3月  4 21:53 peer-jitter-133.243.238.244.png

-rw-r--r-- 1 root root 13949  3月  4 21:53 peer-jitter-2001:df0:232:eea0::fff3.png

-rw-r--r-- 1 root root 15377  3月  4 21:53 peer-jitter-2001:df0:232:eea0::fff4.png

-rw-r--r-- 1 root root 21528  3月  4 21:53 peer-jitters.png

-rw-r--r-- 1 root root 12975  3月  4 21:53 peer-offset-133.243.238.163.png

-rw-r--r-- 1 root root 13160  3月  4 21:53 peer-offset-133.243.238.164.png

-rw-r--r-- 1 root root 15458  3月  4 21:53 peer-offset-133.243.238.243.png

-rw-r--r-- 1 root root 12651  3月  4 21:53 peer-offset-133.243.238.244.png

-rw-r--r-- 1 root root 14015  3月  4 21:53 peer-offset-2001:df0:232:eea0::fff3.png

-rw-r--r-- 1 root root 14103  3月  4 21:53 peer-offset-2001:df0:232:eea0::fff4.png

-rw-r--r-- 1 root root 18939  3月  4 21:53 peer-offsets.png

-rw-r--r-- 1 root root  3848  3月  4 21:53 summary.csv
Zabbix であれば、このテンプレートがそのまま使えると思うけど…。
コメントする